One of the great advantages of digital photography is that it allows you to check exposure immediately after you take the picture using histograms. It is important you learn them.
There are several books and Internet tutorials that explain histograms but make it so complex that many beginners fail to grasp these graphs.
This tutorial demystifies histogram and makes it easy. Real easy. Understand just one tip and you can immediately start taking pictures and using histograms to accurately check exposure.
QUESTION:
“Why do we need histogram when we can see the photo on camera LCD and see how bright or dark it is?”
ANSWER:
But can we really? Can we just by looking at the image on LCD gauge if the dark areas have any detail in them or they have slipped into total blackness? Or if the clouds in the sky will have any texture or be burnt out white? No we cant. Histograms come to the rescue.

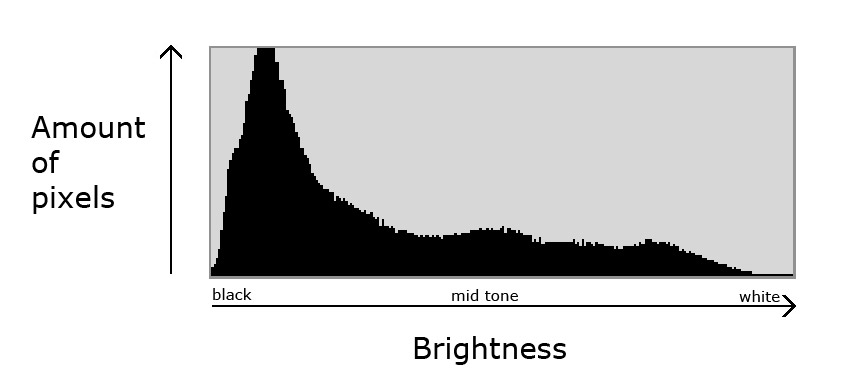
The horizontal axis represents the level of brightness, from pure black to pure white. The vertical axis represents number of pixels. (This graph must represent a photograph with lots of dark areas.)
The Tip
If the histogram does not touch the left or right edges, the photograph retains details in both black and white; if it touches the left edge you are missing black details on part of the image and if it touches on the right, some highlights are overexposed to the extent no details will be seen.
Done!
Nothing else to learn: If you want to retain details in blacks or whites, do not let the graph touch either edge. Happy shooting….
The rest is just examples and pointless discussion. You are welcome to read.
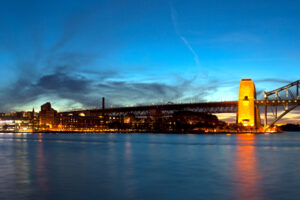
The histogram should match the subject. When you take a photo of a white subject (a brightly lit snow mountain) the histogram should show bulk of pixels in the right area. If the photo is of a night skyline more pixels will be in the left side. There will be instances in non-controlled photography where the histogram will touch the left indicating total loss of details in blacks (a silhouetted horse in the setting sun) or where it will touch on the right indicating clipped whites (flying insects around a bulb). And this is perfectly OK.
Example 1. I exposed this to retain details in the frame, inside the lampshade etc. Notice that no pixels touch the right side of the histogram indicating no clipped (over exposed) whites in the photograph. Also notice there are lots of pixels touching the left side of the graph indicating no details in the blacks.


Example 2. I exposed this to compromise and get the maximum details in both shadows and highlights. Notice the graph touches both ends and causes clipping in both highlight and shadows but there is greater visibility and it better represents how my eye saw the lighting.


Example 3. I exposed for the shadows and ensured the graph does not touch the left edge. Now there is details in the blacks but whites are over exposed.


If you have reached so far, might as well read the rest, it is an important tip. Post processing software allows us to get details in the shadow areas but not in the overexposed areas. So it is better, DEPENDING UPON THE ARTISTIC INTENT, to avoid overexposing the bright areas. Of course ‘pushing’ blacks can show up limitations of the sensor in the form of noise so it is best to expose as correctly as possible and leave minimum for post processing.
Example 2 above evens out the exposure range but it is not my idea of perfect exposure. I prefer to pick the portion of the frame I want to see properly and expose for that. But that is an entirely different discussion. I must do a rant on exposure soon….


Most Commented Posts